Plasma level time curve describes the situation of drug concentration in our body after administration with time (specific time intervals). During clinical trials, the patient’s plasma drug concentration-time profile can be drawn by assessing the plasma concentration at specific time points. By using appropriate blood sampling, an accurate description of the plasma drug concentration-time profile of the pharmacologically active drug substance(s) can be achieved using a validated drug assay. The plasma level time curve is obtained by plotting the concentration of the drug in plasma after administration of a drug (Y-axis) and the corresponding time at which the plasma sample was collected (X-axis). IV Bolus vs IV Infusion
Generally, plasma or serum is utilized the most frequently for direct drug measurement. A drug or drug product enters the systemic circulation after delivery, and over time, plasma drug concentrations increase. The drug is distributed to the intracellular and extracellular regions of the body’s tissues from the systemic circulation after absorption from the GIT, and it is also eliminated at the same time either by excretion, biotransformation, or both processes. Plasma level time curve also known as plasma drug concentration-time profile, plasma concentration-time curve, blood concentration–time curve, blood concentration-time profiles, concentration vs time graph, plasma drug concentration vs. time curve, plasma concentration-time curve, drug concentration vs time graph.
Table of Contents
Definition of the Plasma Level Time Curve
Plasma level time curve is a drug concentration versus time curve that graphically describes the state of drug concentration in our body with time using the pharmacokinetic parameters like peak plasma level (Cmax), time for peak plasma level (tmax), and area under the curve (AUC) as well as pharmacodynamics parameters like onset time, the onset of action, the intensity of action, duration of action, termination of the action, therapeutic range/window, sub-therapeutic level, toxic level, MEC, and MTC /MSC and generally helps to predict dosage regimens and assess the bioavailability of a drug product. Bioavailability vs Bioequivalence
Concentration vs Time Graph of different dosage forms
Plasma level time curve of single immediate release dosage forms
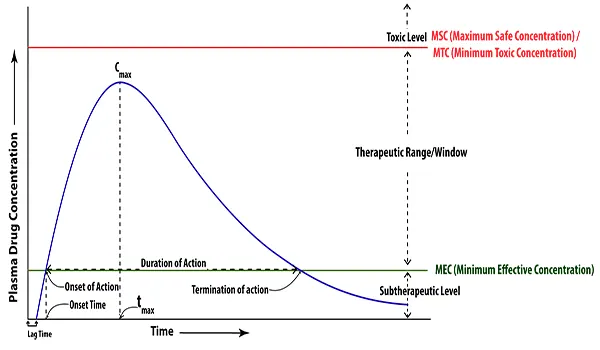
Figure: Plasma level time curve of immediate release dosage forms after oral administration of a single dose
Drug concentration vs time graph of multiple doses
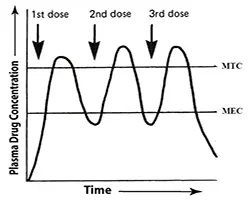
Figure: Drug concentration vs time graph of multiple doses of immediate-release dosage forms
Plasma level time curve of a single intravenous bolus dose
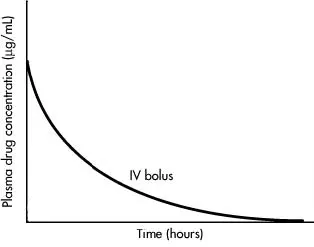
Figure: Plasma level time curve of a single intravenous bolus dose of a drug
Plasma drug concentration-time profile for constant IV infusion
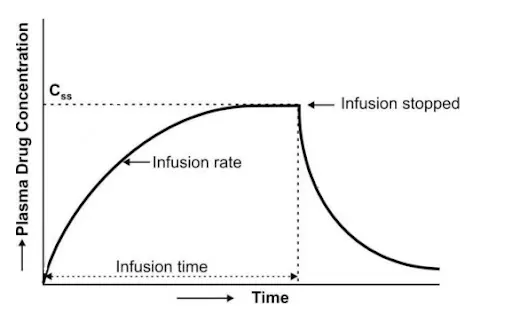
Figure: Plasma drug concentration-time profile for constant IV infusion
Drug concentration vs time graph of single sustained release dosage forms

Figure: Drug concentration vs time graph of controlled release / sustained release dosage forms after administration of a single dose
Parameters of the plasma drug concentration-time profile
A typical plasma drug concentration vs. time graph is obtained after a drug dose is administered. A plasma concentration-time profile may be used to examine two different types of parameters:
A. PHARMACOKINETIC PARAMETERS
Three important parameters are related to drug movement in assessing the bioavailability of a drug from its formulation:
Peak plasma concentration (Cmax)
The peak plasma drug concentration is the maximum drug concentration in plasma after the administration of drugs. It is crucial for assessing the safety of drugs. Additionally, it reflects the drug’s toxicity level in the body. Cmax is frequently used in bioequivalence studies as a surrogate measure for the rate of drug bioavailability. The magnitude of the pharmacological effect was correlated with the peak plasma drug concentration. For the intended therapeutic response, Cmax should be higher than MEC but lower than MSC. The peak plasma drug concentration depends on the administered dose and rates of absorption and elimination. The concentration units used to represent the units of Cmax are mg/mL, g/mL, and ng/mL.
Time of peak concentration (tmax)
The time of peak plasma concentration is the time required to reach peak plasma drug concentration (Cmax) after drug administration and is a rough marker of the average rate of drug absorption. At tmax, the rate of drug absorption precisely equals the rate of drug elimination. As the drug’s absorption rate increases, the value for tmax will decrease (indicating less time is needed to reach peak plasma concentration). It is useful in estimating the onset of action and rate of absorption. Units of time used to express the units of tmax are hours and minutes.
Area under the curve (AUC)
The area under curve (AUC) or area under the blood (or plasma) concentration–time curve is a measurement of the extent of drug bioavailability i.e. the total amount of the drug that has effectively reached the systemic circulation after its administration. The actual body exposure to a drug after administration of dosage is represented by the area under the plasma drug concentration-time curve (AUC), which is expressed in mg*h/L, or μg/ml x hours, or mg*hr*L-1. The drug’s clearance is negatively correlated (inversely proportional) with the AUC.
B. PHARMACODYNAMIC PARAMETERS
These crucial parameters are related to drug action.
Minimum Effective Concentration (MEC)
Minimum Effective Concentration (MEC) is the minimum concentration of drug in plasma or at the receptor site required to produce the desired therapeutic effect.
Maximum safe concentration (MSC) or Minimum Toxic Concentration (MTC)
The minimum toxic concentration is the minimum drug concentration needed to just barely produce a toxic effect. In other words, drug concentration in plasma at which undesirable effects begin to manifest.
Onset time
Onset time is the time at which a drug is initiated to induce pharmacological responses. In other words, the onset time is the time for the plasma concentration to reach MEC after the administration of a drug.
Lag time
The time delay prior to the commencement of first-order drug absorption is known as lag time. Some people have delayed drug absorption after a single oral dosage due to physiological variables such as intestinal motility and stomach emptying time.
Onset of action
Onset of action is the commencement of pharmacologic effects. It happens when the plasma drug concentration barely goes above the necessary MEC.
Duration of action
Duration of action is the time period for which the plasma concentration of the drug remains above the MEC level. In other words, the duration of drug action is the difference between the onset time and the time for the drug to decline back from the MEC.
Termination of action
Termination of action is the end of pharmacologic responses. When the plasma drug concentration falls back from the MEC, it happens.
Intensity of action
Intensity of action is the extreme pharmacologic response produced by the peak plasma concentration (Cmax) of a drug.
Therapeutic Range/Window
The therapeutic range is the drug concentration between MEC and MSC. It is the drug’s safest concentration at which it will have the optimum therapeutic responses. Drugs produce undesirable or unpleasant effects if its concentration exceeds therapeutic windows, and if its concentration falls below, drugs produce sub-therapeutic effects.
Subtherapeutic Level
Drug concentrations below MEC are considered sub-therapeutic levels, and at these concentrations, the drug will have sub-therapeutic effects.
Toxic Level
The term “toxic level” refers to the concentration of a substance that causes toxic or adverse or unwanted effects when it is higher than the MTC or MSC. or toxic effects.
Significance of Plasma Level Time Curve
- The plasma drug concentration versus time curve is most frequently used to determine the systemic bioavailability of a drug from a drug product.
- Helps to predict dosage regimens for single oral and IV bolus doses, multiple-dose regimens, IV infusions etc.
- Allows for the development of a drug product that consistently delivers a drug in a predictable manner [1].
- Used to characterize the therapeutic effect of a drug for a specific dosage or formulation [2].
- Helps in estimating the dosage regimens (dose and dosing interval) of a drug for each patient individually.
- Assists in making sure the estimated dosage truly produces the plasma level needed for the therapeutic effect.
- Correlate pharmacologic or toxicologic action to drug concentrations.
- Compare the rate or extent of availability of various formulations (bioequivalence).
- Describe how alterations in physiology or the presence of disease impact the drug’s absorption, distribution, or elimination.
- Determine the effects of diet, disease, and physiological state.
- It provides a graphical illustration of the rate process.
- Parameters including AUC, time for peak drug concentration, and peak drug concentration are used to describe the bioavailability of the drug.
References
- Shargel L. Yu A. B. C. & Wu-Pong S. (2012). Applied biopharmaceutics & pharmacokinetics (6th ed.). McGraw-Hill Medical.
- Ping-Hsun Chen (2019). Plasma Concentration-Time Profile” as an Indefinite Claim Term: A Lesson from Forest Labs., Inc. v. Teva Pharm. USA, Inc..Biotechnology Law Report. 154-164. http://doi.org/10.1089/blr.2019.29116.phc
Keywords: Plasma level time curve, plasma drug concentration-time profile, plasma concentration-time curve, drug concentration vs time graph.