AUC in pharmacokinetics (Area Under the Curve) is a vital parameter of the plasma level time curve. AUC is also known as the zero moment curve. It is a crucial measure of the bioavailability of a drug after administration. Also, the Area under the curve is a vital factor used in bioequivalence studies. In pharmacokinetics, AUC has an inverse relationship with drug clearance while directly correlated with drug absorption. The given dose and the rate of drug elimination from the body both affect this area under the curve. As long as the drug elimination processes remain constant, the AUC is unaffected by the route of administration and drug elimination.
Table of Contents
Definition of AUC in Pharmacokinetics
AUC in pharmacokinetics is the area under the curve of concentration versus time from zero to infinity. The area under curve (AUC) or area under the plasma level time curve or area under the blood (or plasma) concentration-time curve is the measurement of the extent of drug bioavailability i.e. the total quantity of active drug that effectively reaches the systemic circulation after administration of the drug. Also, AUC is known as the zero moment curve.
So, the AUC is the area under the drug plasma level-time curve from t = 0 to t = ∞ and is equal to the amount of unchanged drug reaching the general circulation divided by the clearance [1].
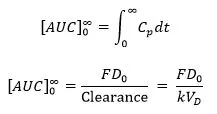
where, F = fraction of dose absorbed, D0 = dose, k = elimination rate constant, and VD = volume of distribution.
Unit of AUC in Pharmacokinetics
AUC in pharmacokinetics represents the actual body exposure to the drug after the administration of a dose of the drug. Generally, area under the curve is reported in amount/ volume x time.
AUC in pharmacokinetics units is expressed in mg x h / L or μg / ml x hrs or µg hr/mL or mg x L-1 x hr or g/100 mL x hr or g hr/mL [1,2]
Factors Affecting AUC in Pharmacokinetics
The AUC is dependent on the following factors:
- Dose (D)
- Bioavailability (F)
- Total clearance (ClT)
- Elimination rate constant (k)
- Apparent volume of distribution (VD)
- Solubility of the drug [2]
- Route of administration [3]
Moreover, as long as the drug elimination processes remain constant, the AUC is unaffected by the route of administration and drug elimination [1].
Significance of AUC in Pharmacokinetics, Biopharmaceutics, and Toxicology
The amount of drugs in the body after administration is represented by the AUC. The area under the plasma level time curve has several essential uses in biopharmaceutics, pharmacokinetics, and toxicology. The list of the significance of the Area Under the Curve (AUC) is as follows:
A. Monitor Pharmacokinetics Parameters: AUC can be considered representative of the total amount of drug absorbed following administration of a single dose of the drug. Also, AUC provides data about distribution and elimination within the body after administration over time.
B. Assess the Bioavailability of a drug: Pharmacokinetics parameters including AUC, peak drug concentration, and time for peak drug concentration are used to describe the bioavailability of the drug. The extent of bioavailability is generally assessed by using [AUC]0 ∞.
C. Analyse the Bioequivalence of the generic drug product: Bioequivalence is mostly assessed using a comparison of population averages of bioequivalence metrics such as AUC and C max. Generally, to claim bioequivalence of a generic drug product, the AUC and Cmax parameters for the test (generic) medicine should be within 80-125% of the reference medicine using a 90% confidence interval.
D. Improve Drug Safety: The area under the curve is a key forecaster of the safety of a drug. In toxicology, AUC can be used as a measure of drug exposure in the body after administration over time. A greater AUC over minimum toxic concentration (MTC) usually indicates a greater risk of adverse effects. Therefore, the risk of adverse effects may be minimized by knowing the drug exposure in the body within therapeutic windows.
E. Improve Drug Efficacy: The AUC is a key determinant of the therapeutic effects of a drug. A smaller AUC under minimum effective concentration (MEC) usually indicates the chance of submaximal therapeutic effects. So, the submaximal therapeutic effects may be optimized and improve drug efficacy by knowing the drug exposure in the body.
F. Optimize Dosage regimen: AUC is used to optimize the dosage regimen by determining the dose as well as the dosing interval to attain the desired drug exposure.
G. Regulatory approval of drugs: AUC is a crucial pharmacokinetic parameter used to meet regulatory standards for bioequivalence and bioavailability study in regulatory approval of drugs by government or health authorities such as USFDA, MHRA, Health Canada, and TGA.
H. Therapeutic drug monitoring of drugs: AUC is used in the therapeutic drug monitoring of drugs with a narrow therapeutic index. For example, the AUC of Gentamicin is used to guide the dosage of this drug.
I. Measure free and Protein Binding Drugs: Help to measure the free drug concentration in plasma.
J. Estimate of VD: Volume of distribution (VD) is generally estimated from the area under the curve (AUC).
K. Evaluate the clearance of a drug.
L. Help to calculate mean residence time using the equation MRT = AUMC/AUC.
M. Also, estimate the half-life of a drug.
Software for Calculating the AUC
You can calculate AUC from the area under the curve calculator from symbolab, but in biopharmaceutics, The AUC can be calculated using several software packages such as:
- RSTRIP
- NCOMP
- Phoenix WinNonlin
- MATLAB
- R
- SAS
- WinSAAM
- OpenBUGS
- GraphPad Prism
- PKSolver
Methods for Calculating the AUC
In Biopharmaceutics, the method of calculation of the Area Under the Curve (AUC) depends on the type of data collected and the properties of the drug under investigation.
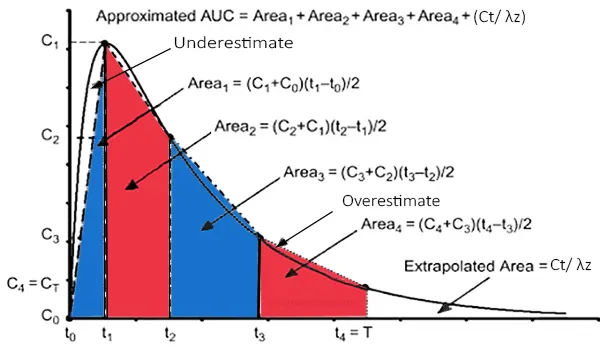
- Trapezoidal rule: the most frequently used numerical method for approximating AUC.
- Simpson’s rule: one of the numerical methods used to evaluate the definite integral.
- Linear-up/log-down rule: generally used for drugs that exhibit non-linear pharmacokinetics.
- Cut & Weigh method
- Planimeter, also recognized as platometer: A measuring instrument used to determine the AUC.
- Counting Squares method
- Non-compartmental method: involves calculating the AUC, clearance, volume of distribution, and half-life.
- Compartmental method: involves fitting pharmacokinetic models such as one- or two-compartment models.
How to calculate AUC in pharmacokinetics?
Area Under The Curve (AUC) from time zero to time t (AUC 0-t) [2]
1. Firstly, for each individual, plot the plasma drug levels and the corresponding time data.
2. Draw vertical lines from each data point to the x-axis to divide the curve into trapezoids.
3. Apply the following formula to determine the area of the trapezoids:
• AUC (t2-t1) = [(C2 + C1) (t2 – t1)] / 2
4. Finally, AUC (0-t) is then calculated by summing the individual areas to the time of the last concentration:
• AUC (0-t) = AUC (t2-t1) + AUC (t3-t2) + … + AUC (tn-(tn-1))
where [AUC] stands for the area under the curve, tn is the time of observation of drug concentration Cn , and tn-1 is the time of prior observation of drug concentration corresponding to Cn-1.
Area Under The Curve (AUC) from time zero to infinity AUC 0-∞ [2]
5. The tail portion of the curve must be included to the AUC (0-t) to calculate AUC (0-∞). The overall drug exposure over time is represented by AUC (0-∞).
• AUC (0-∞) = AUC (0-t) + AUC “tail”
6. AUC “tail” = Ct/ λz
Where Ct is the final concentration that can be detected and λz is the final elimination rate constant.
Note that: AUC (0-t) is employed when the AUC (0-t) represents < 80% of the AUC (0-∞). AUC (0-∞) (from zero to infinity) is utilized for the bioequivalence study of a drug product when the AUC (0-t) represents ≥80% of the AUC (0-∞). When drugs with extended half-lives, for example, diazepam and vortioxetine are assessed, AUC (0-t) is employed and is shortened at 48 or 72 hours [2].
Steps for using the trapezoidal rule for calculating Area Under The Curve (AUC)
Segmenting the entire AUC into trapezoidal segments
⇓
Calculating each segment’s area individually
⇓
Totalization of the entire area
⇓
Overall area
Relation of AUC with Dose
The AUC is directly correlated with an administered dose for several drugs. The AUC and steady-state drug concentrations are directly correlated with dose size. When the dose is increased, a drug with linear pharmacokinetics often has a constant elimination half-life and constant clearance. Moreover, Cl, t1/2, and AUC are dose-dependent drugs with nonlinear pharmacokinetics.
Due to the saturation of the drug elimination routes, the AUC for some drugs is not directly proportional to the administered dose at all dosage levels. With each subsequent dose increase for drugs like salicylate and phenytoin, one of the enzyme ways for drug metabolism becomes saturated, lengthening the elimination half-life as a result. Because the additional drug is retained, the AUC rises disproportionally to the increase in dose.
AUC bioavailability Relation
Generally, the best trustworthy measure of the bioavailability of drugs is AUC. AUC in pharmacokinetics is directly proportional to the total quantity of unchanged drugs that extend in the systemic circulation. Bioavailability is measured on a continuous range from 0 to 1 but can be denoted as a %.
F = AUC for x route of administration ÷ AUC for IV administration
In conclusion, AUC is utilized in clinical practice, developing drugs, and regulatory approval of medicines. In Biopharmaceutics, the Area Under the Curve (AUC) is an essential parameter that offers data regarding pharmacokinetics, bioavailability, dose optimization, efficacy as well as safety of a drug.
Keywords: Area under the curve, or AUC, Area under the plasma level time curve, Area under the curve of Concentration versus Time, Area under the Concentration – Time Curve, Area under the plasma drug level-versus-time curve, AUC in pharmacokinetics, Area under the concentration-time curve, AUC curve, Area under the curve (pharmacokinetics).
References
1. Shargel L. Yu A. B. C. & Wu-Pong S. (2012). Applied biopharmaceutics & pharmacokinetics (6th ed.). McGraw-Hill Medical.
2. Remington J. P. & Allen L. V. (2013). Remington: the science and practice of Pharmacy (22nd ed.). Pharmaceutical Press.
3. Olivares-Morales A, Hatley OJ, Turner D, Galetin A, Aarons L, Rostami-Hodjegan A. (2014). The use of ROC analysis for the qualitative prediction of human oral bioavailability from animal data. Pharm Res. 31(3):720-30.